Images for Reference Testing
This is a more or less uncurated list of figures which are used for reference testing. They might be interesting but they are most probably not.
Test different nlabels_align modes
using Graphs, GraphMakie, CairoMakie, NetworkLayout
import DataStructures: DefaultDict

g = SimpleGraph(9)
nlabels_align = [(:right, :bottom),
                 (:center, :bottom),
                 (:left, :bottom),
                 (:right, :center),
                 (:center, :center),
                 (:left, :center),
                 (:right, :top),
                 (:center, :top),
                 (:left, :top)]

nlabels = repr.(nlabels_align)
nlabels_fontsize = 10

fig, ax, p = graphplot(g; layout=SquareGrid(), nlabels, nlabels_align, nlabels_fontsize)
graphplot!(g; layout=SquareGrid(), nlabels, nlabels_align, nlabels_distance=30,
           nlabels_color=:red, nlabels_fontsize)
hidedecorations!(ax); xlims!(-2,4); ylims!(-4,2)
fig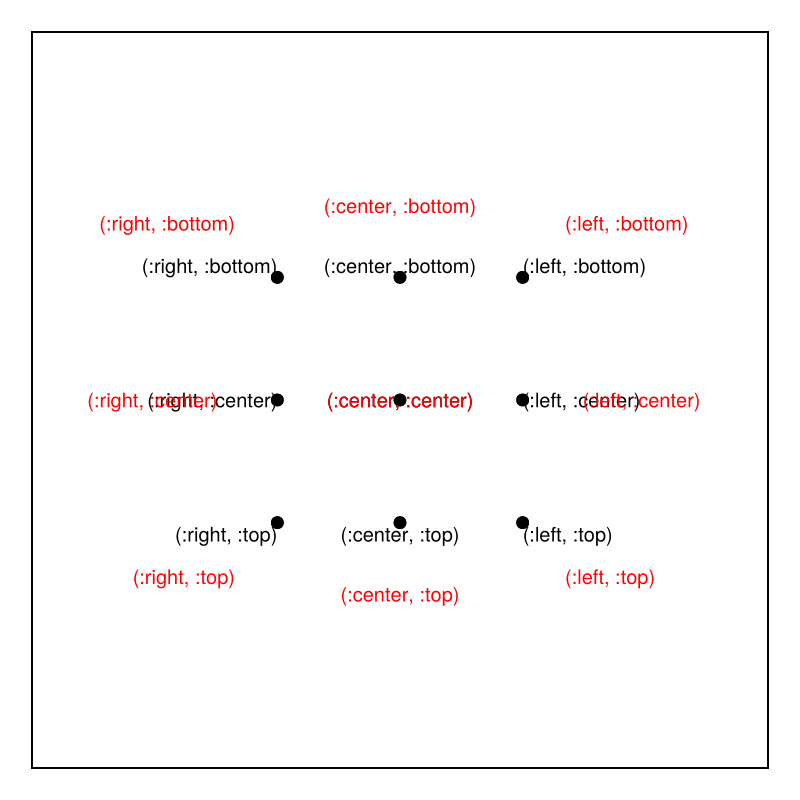
change the align
pop!(ax.scene.plots) # remove red plot
p[:nlabels_distance] = 10
p[:nlabels_align][] = [(:left, :bottom) for i in 1:nv(g)]
p[:nlabels][] = ["↙" for i in 1:nv(g)]
p[:nlabels_offset][] = Point2(0.1,0.2)
fig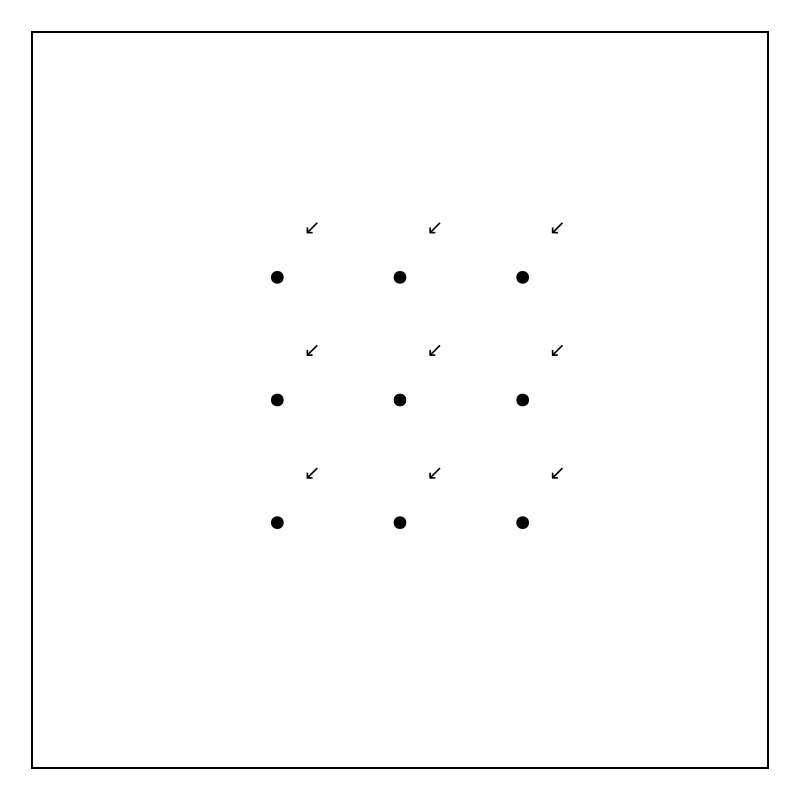
variable offsets
p[:nlabels_distance] = 0
p[:nlabels_align][] = [(:center, :center) for i in 1:nv(g)]
p[:nlabels][] = ["×" for i in 1:nv(g)]
p[:nlabels_color][] = :red
p[:nlabels_offset][] = [Point2(.1*cos(-2π/9*i),.1*sin(-2π/9*i)) for i in 1:nv(g)]
fig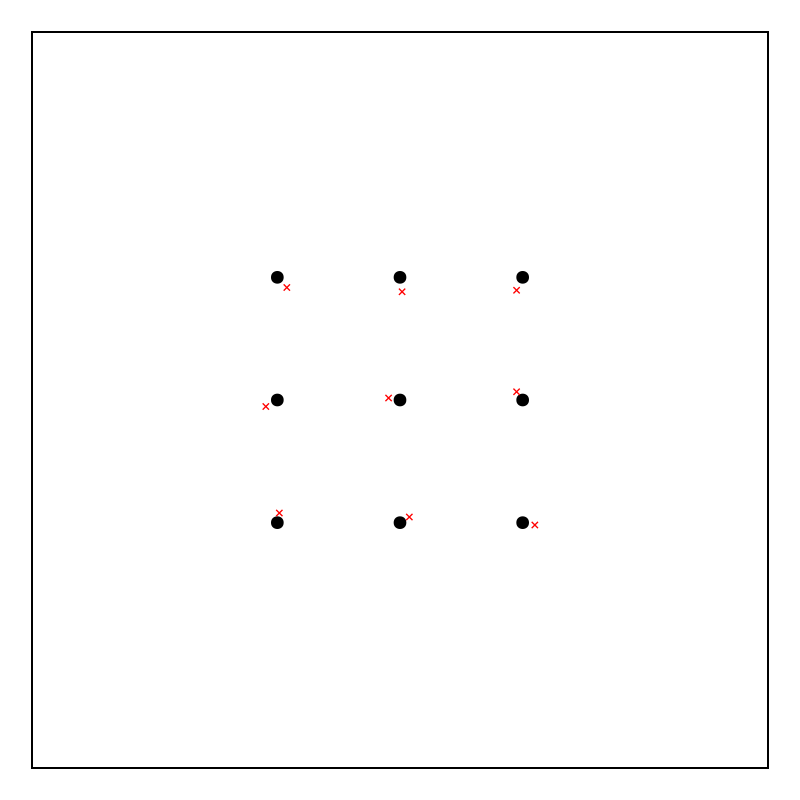
Edge label placement
g = path_graph(4)
elabels = ["a" for i in 1:ne(g)]
elabels_align = (:center, :center)
fig, ax, p = graphplot(g; layout=SquareGrid(), elabels, elabels_align,
                       elabels_color=:red)
hidedecorations!(ax)
fig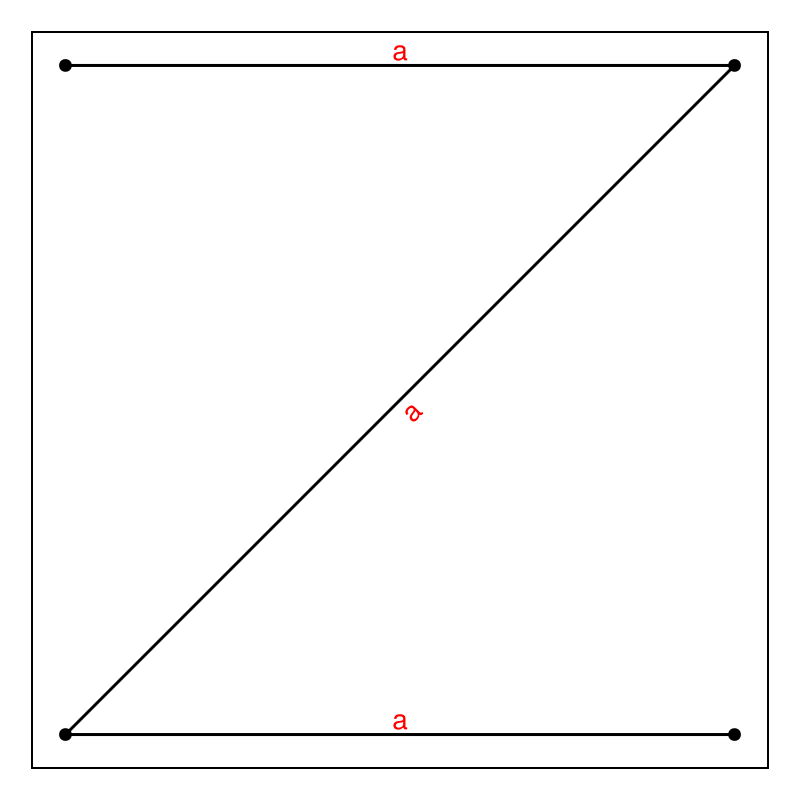
change the positioning of the edge labels
p[:elabels][] = repr.(edges(g))
p[:elabels_shift][] = [0.25, 0.5, 0.75]
p[:elabels_rotation][] = [π/8, 0, -π/8]
p[:elabels_offset][] = Point2(0.05,0.05)
p[:elabels_fontsize][] = 10
autolimits!(ax)
fig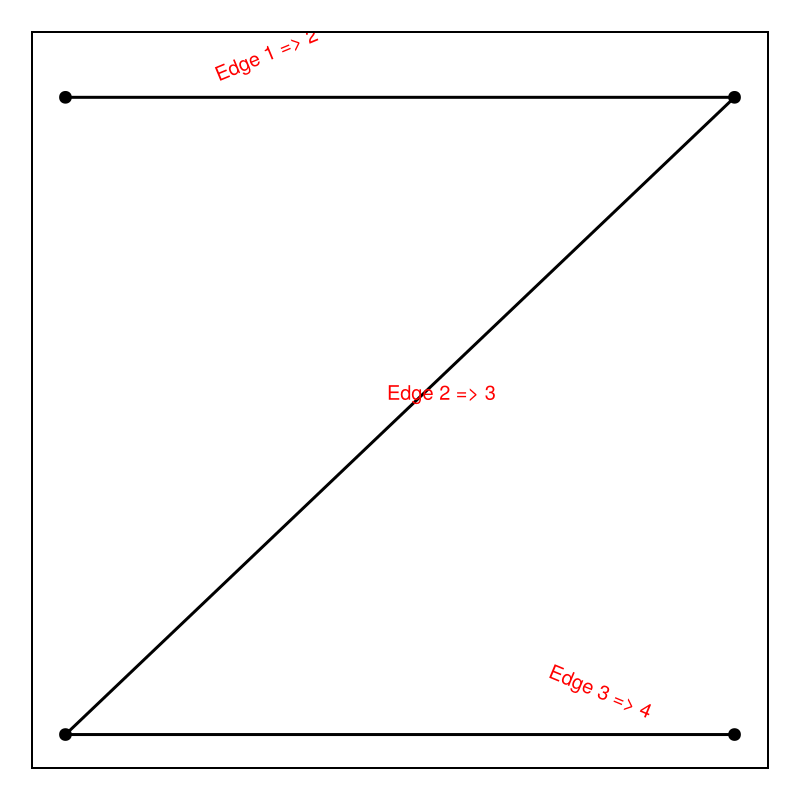
Changes of node positions
edge and node labels follow graph movement
g = complete_digraph(3)
elabels = repr.(edges(g))
nlabels = repr.(1:nv(g))
fig, ax, p = graphplot(g; elabels, nlabels, elabels_fontsize=10)
hidedecorations!(ax)
fig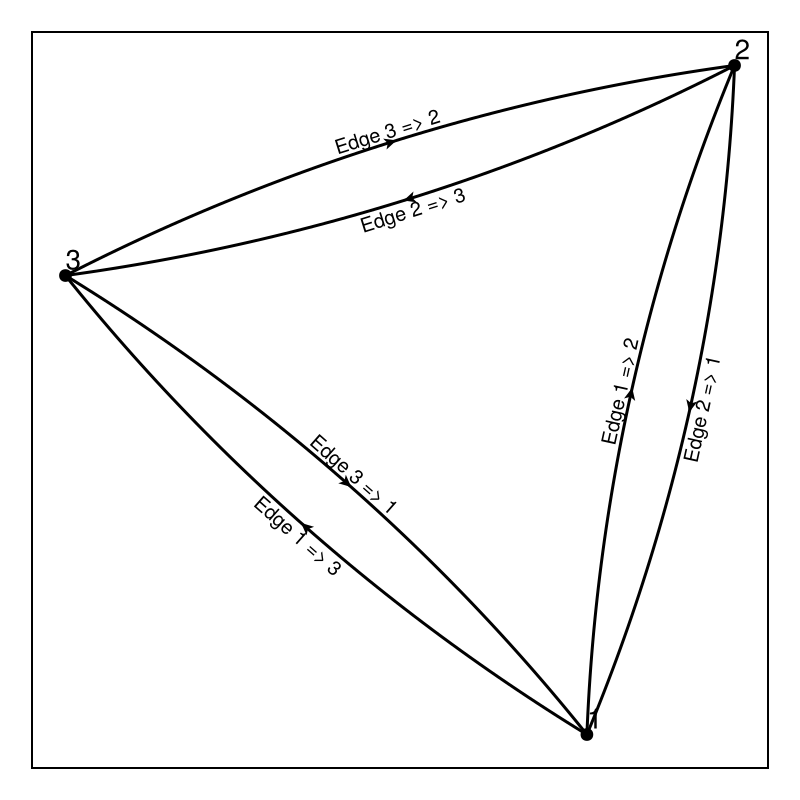
limits!(ax, ax.finallimits[]) # freeze the limits
p[:node_pos][] = Point2f.([(1., -.5), (-1.,0.), (-1.,-1.)])
hidedecorations!(ax)
fig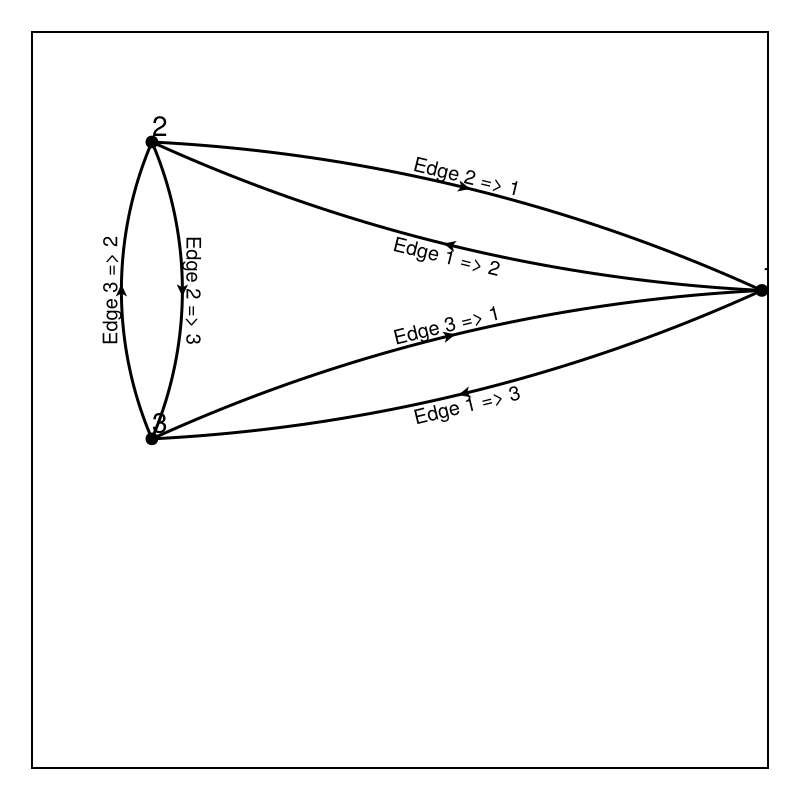
Change of the underlying graph
gn = Observable(SimpleDiGraph(3))
fig, ax, p = graphplot(gn)
hidedecorations!(ax)
fig

add_edge!(gn[], 1, 2)
add_edge!(gn[], 1, 3)
add_edge!(gn[], 2, 3)
notify(gn)
autolimits!(ax)
fig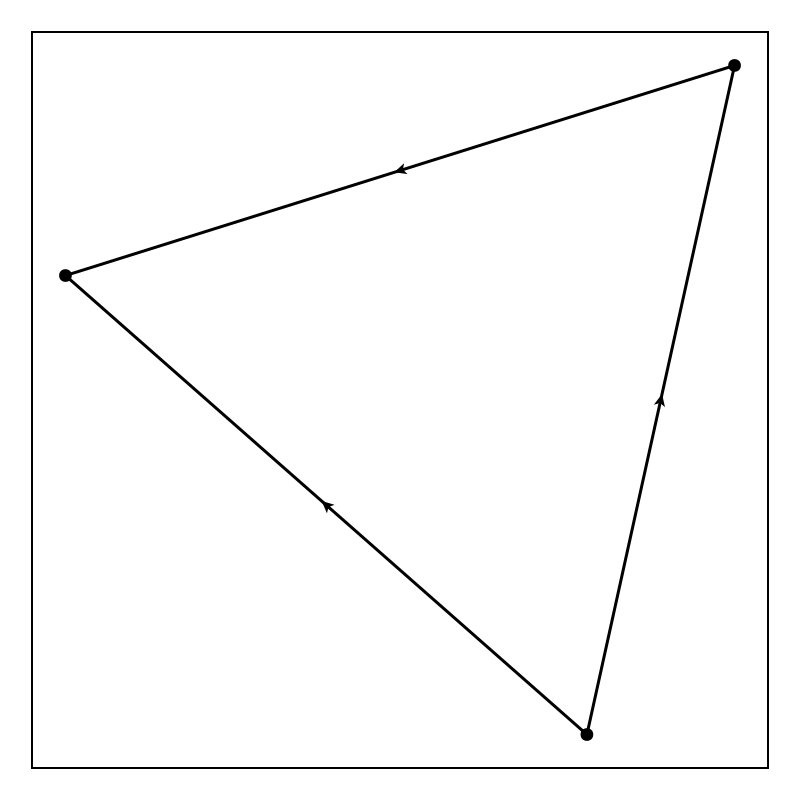
add another edge
add_edge!(gn[], 2, 1)
notify(gn)
fig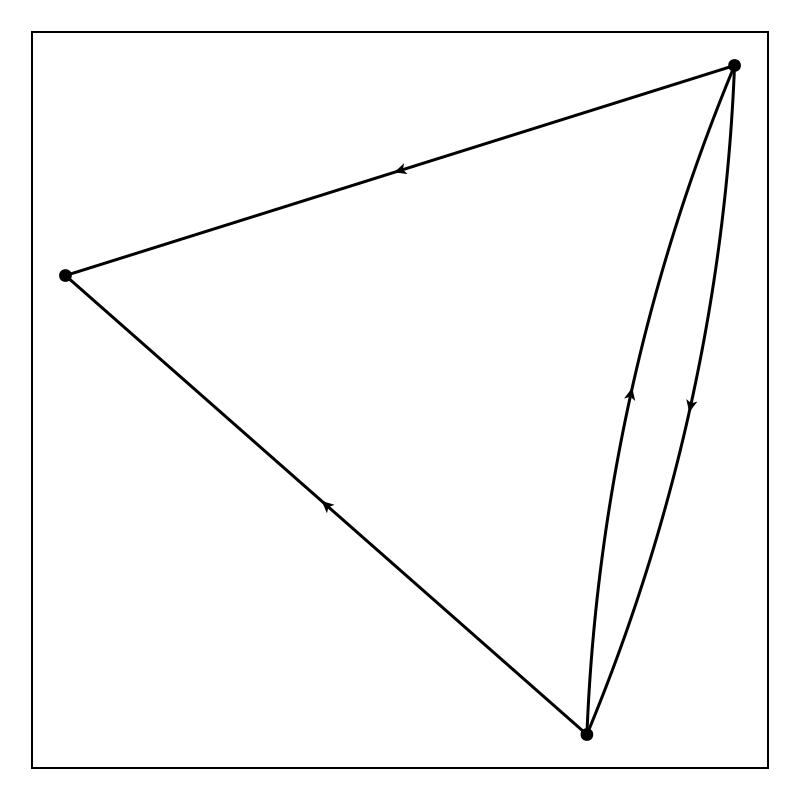
Different combinations of edge width and edgelabel distance
g = path_graph(3)
layout(y) = Point2f.([(0,-y),(1,-y),(2,-y)])
elabels = ["Edge 1", "Edge 2"]
node_color = :red

fig, ax, p = graphplot(g; layout=layout(0), elabels, node_color)
graphplot!(g; layout=layout(1), elabels, node_color, edge_width=10, elabels_fontsize=25)
graphplot!(g; layout=layout(2), elabels, node_color, edge_width=25, elabels_fontsize=15)
graphplot!(g; layout=layout(3), elabels, node_color, edge_width=25, elabels_fontsize=[15,25])
graphplot!(g; layout=layout(4), elabels, node_color, edge_width=[10,25], elabels_fontsize=25)
autolimits!(ax); hidedecorations!(ax); hidespines!(ax); ylims!(-5,1)
fig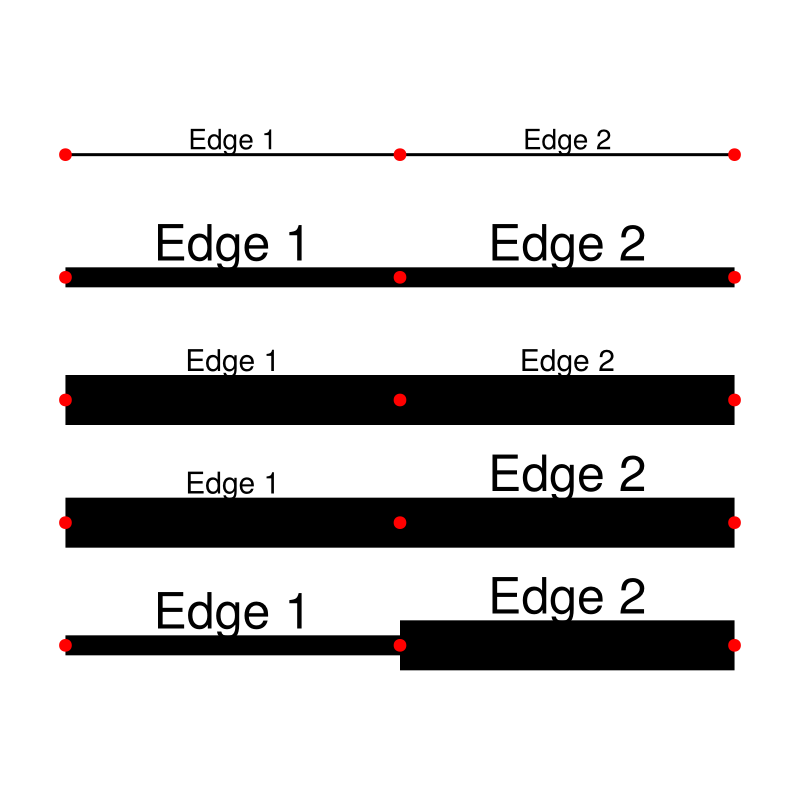
Different linestyles per edge
fig = Figure()
graphplot(fig[1,1],
          DiGraph([Edge(1 => 2), Edge(2 => 3)]),
          edge_linestyle = [:dot, :dash],
          )
hidedecorations!(current_axis())

graphplot(fig[1,2],
          DiGraph([Edge(1 => 2), Edge(2 => 1)]),
          edge_linestyle = [:dot, :dash],
          )
hidedecorations!(current_axis())

graphplot(fig[2,1], layout=Stress(),
          DiGraph([Edge(1 => 2), Edge(2 => 3), Edge(3=>4), Edge(4=>1)]),
          edge_linestyle = Linestyle([0.5, 1.0, 1.5, 2.5]),
          )
hidedecorations!(current_axis())
fig
fig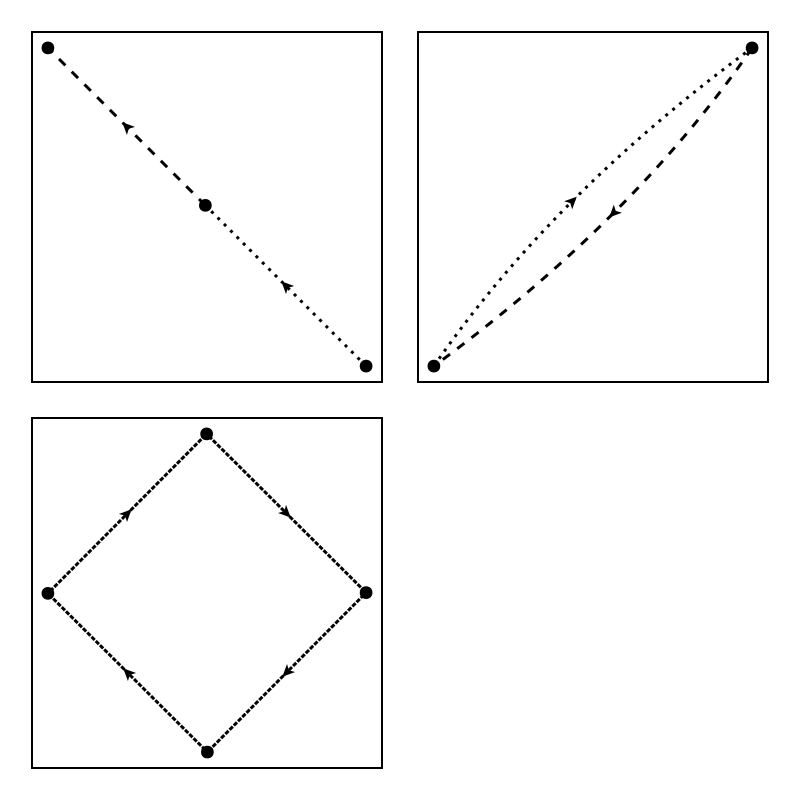
Self loop with waypoints
g1 = SimpleDiGraph(1)
add_edge!(g1, 1, 1) #add self loop
fig, ax, p = graphplot(g1, layout = [(0,0)], waypoints = [[(1,-1),(1,1),(-1,1),(-1,-1)]])
hidedecorations!(ax)
fig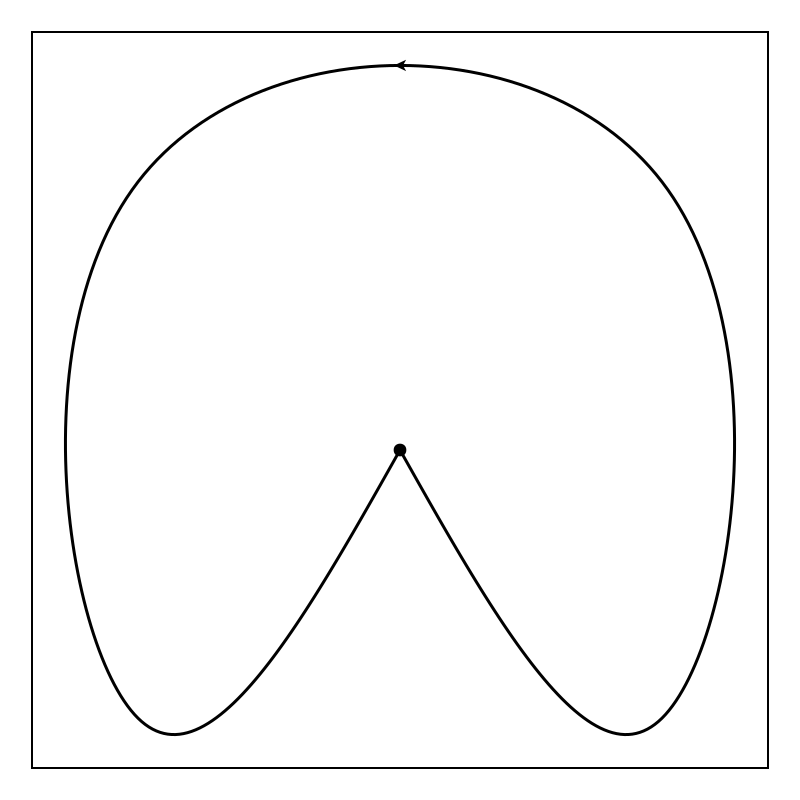
Shift arrows to nodes
fig, ax, p=graphplot(SimpleDiGraph(ones(2,2)),node_size=50,arrow_size=20,curve_distance=0.5,arrow_shift=:end)
hidedecorations!(ax)
fig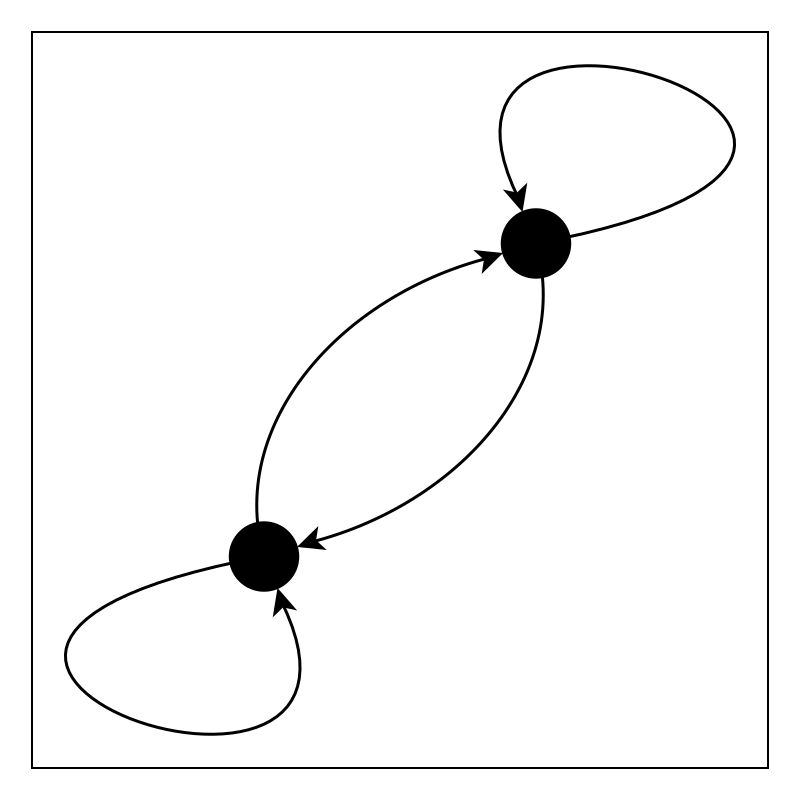
update shifts
g = SimpleDiGraph(3)
add_edge!(g, 1, 1); add_edge!(g, 1, 2); add_edge!(g, 2, 1); add_edge!(g, 2, 3); add_edge!(g, 3, 1);
test update of node and arrow size, and node position
fig, ax, p = graphplot(g; arrow_shift=:end,
                       node_size=[20 for _ in 1:nv(g)],
                       arrow_size=[20 for _ in 1:ne(g)])
hidedecorations!(ax)
fig

p.node_size[][1] = 40
p.node_size[] = p.node_size[]
fig

p.arrow_size[][3] = 40
p.arrow_size[] = p.arrow_size[]
fig

p.node_pos[][1] = (0,0)
p.node_pos[] = p.node_pos[]
fig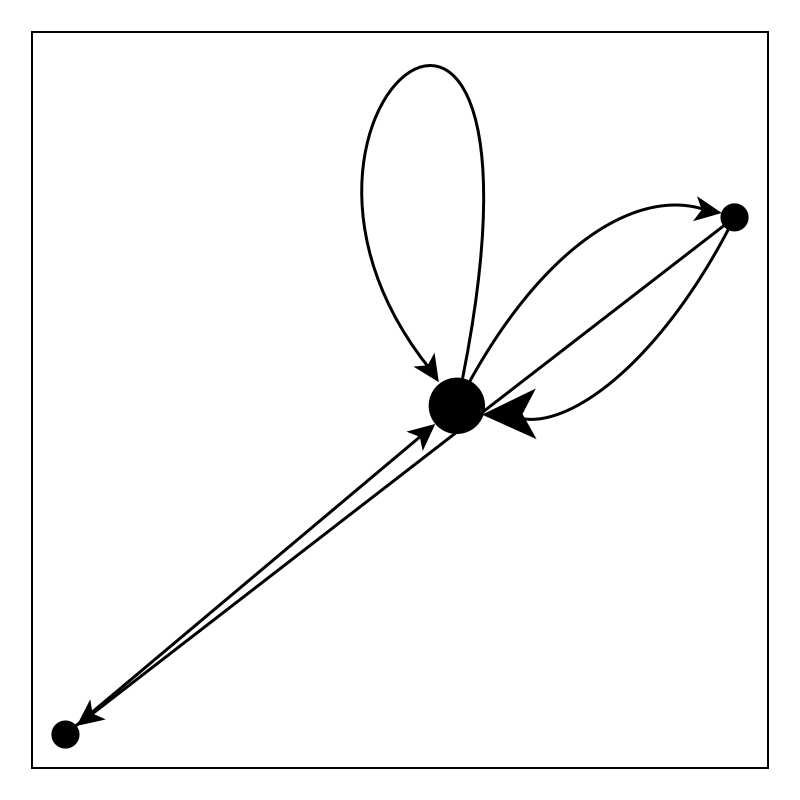
test large nodes
using GraphMakie: SquareGrid
g = SimpleDiGraph(8)
add_edge!(g, 1, 2)
add_edge!(g, 3, 4)
add_edge!(g, 5, 6)
add_edge!(g, 7, 8)

fig, ax, p = graphplot(g; arrow_shift=:end, layout=SquareGrid(cols=2),
                       node_size=[10, 10, 10, 100, 10, 200, 10, 300],
                       arrow_size=[150,100,50,10],
                       arrow_attr=(color=:blue,),
                       edge_color=:red)
xlims!(-.5,1.5); ylims!(-3.5,.5)
hidedecorations!(ax)
fig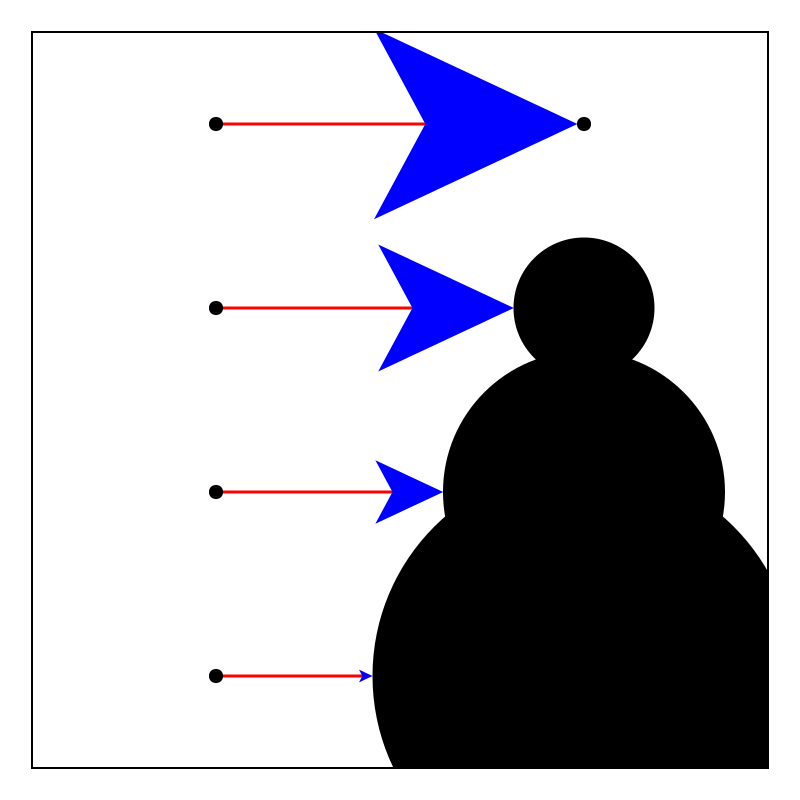
Inner node labels
fig, ax, p = graphplot(cycle_digraph(3), ilabels=[1, L"\sum_{i=1}^n \alpha^i", "a label"], node_marker=Circle)
hidedecorations!(ax)
fig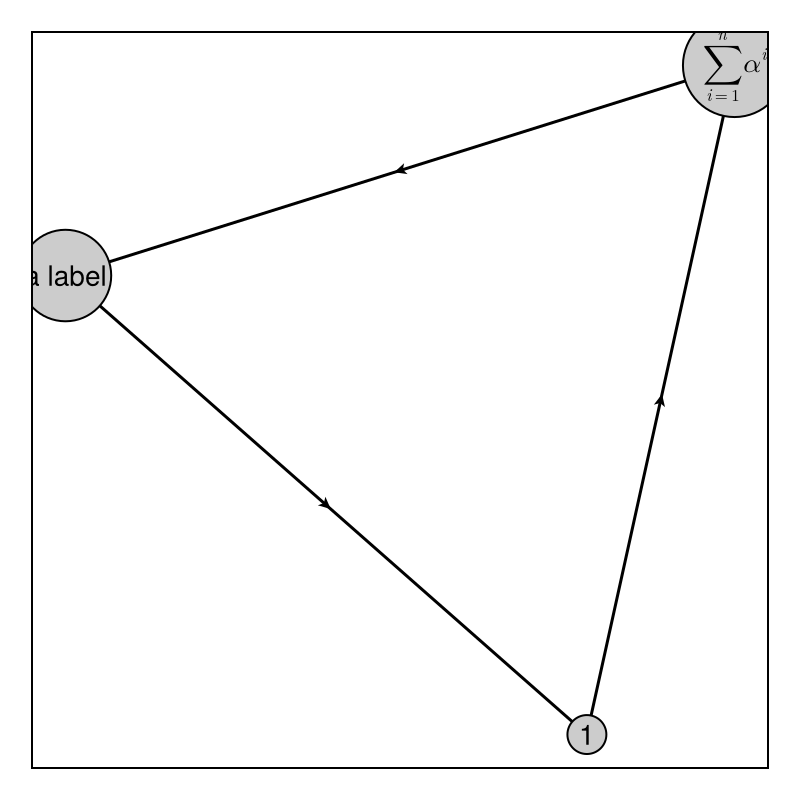
Interact with arrow_shift=:end
fig, ax, p = graphplot(cycle_digraph(3), ilabels=[1, L"\sum_{i=1}^n \alpha^i", "a label"], node_marker=Circle, arrow_shift=:end)
hidedecorations!(ax)
fig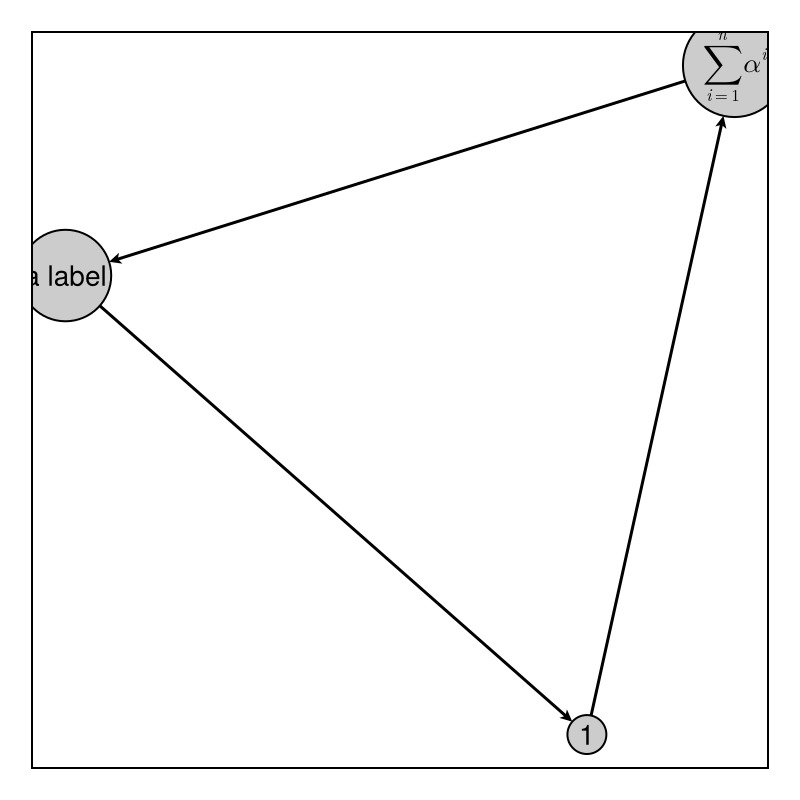
Update observables
p.node_size[] = DefaultDict(Makie.automatic, Dict{Int, Any}(2=>100))
p[:ilabels][][1] = "1111"
p[:ilabels][] = p[:ilabels][]
fig

p[:ilabels_fontsize][] = 10
fig

p[:node_color][] = :red
fig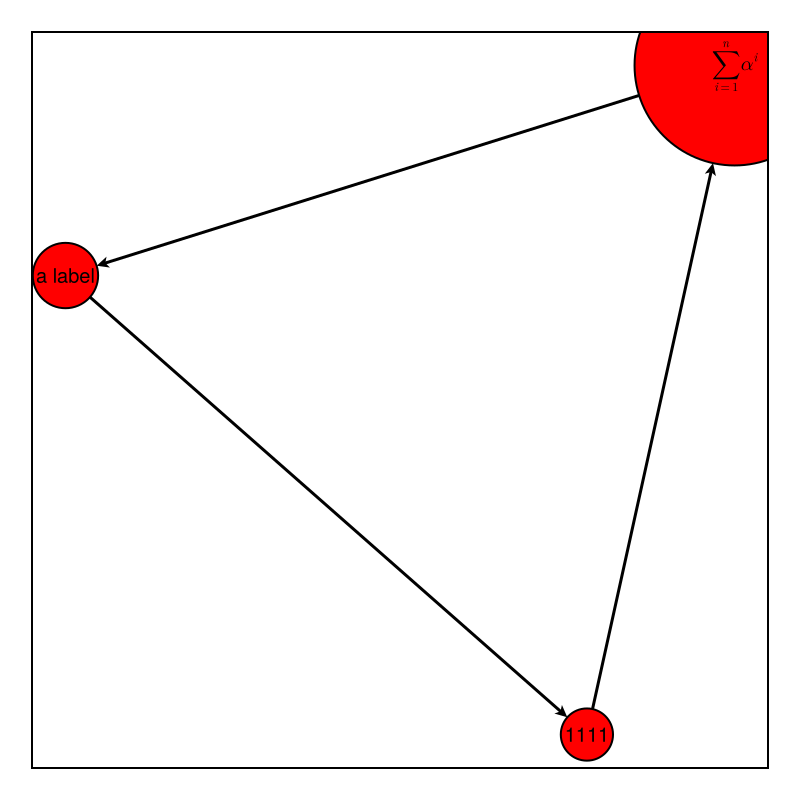
Changes of node and label sizes
gc = circular_ladder_graph(5);
ons = Observable(30);
onf = Observable(30);
fig,ax,p = graphplot(gc; nlabels=repr.(vertices(gc)), node_size=ons, nlabels_fontsize=onf)
hidedecorations!(ax)
fig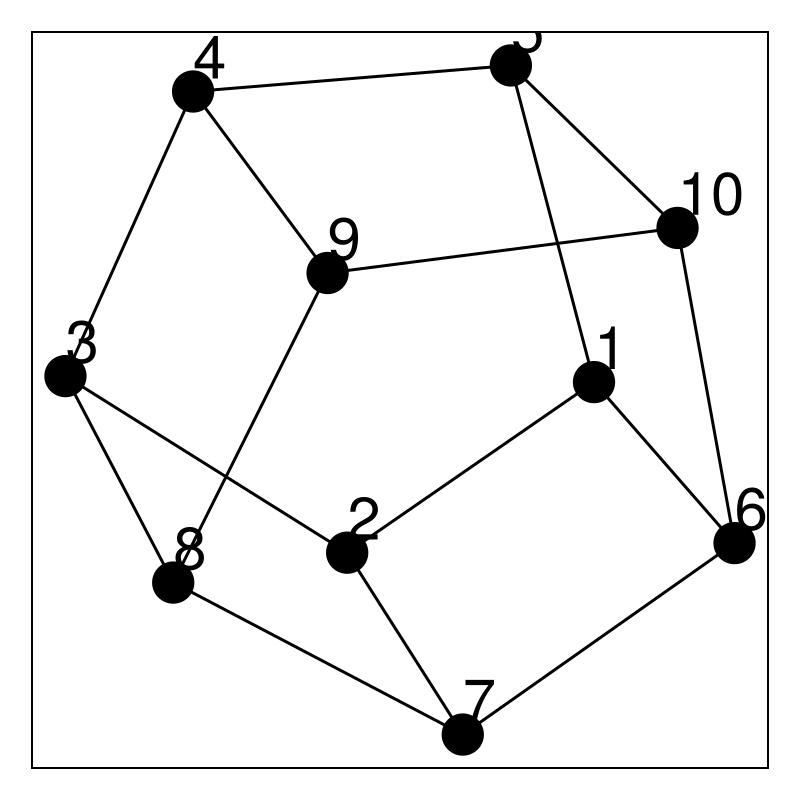
Change node size
ons[] = 10; # check changes
fig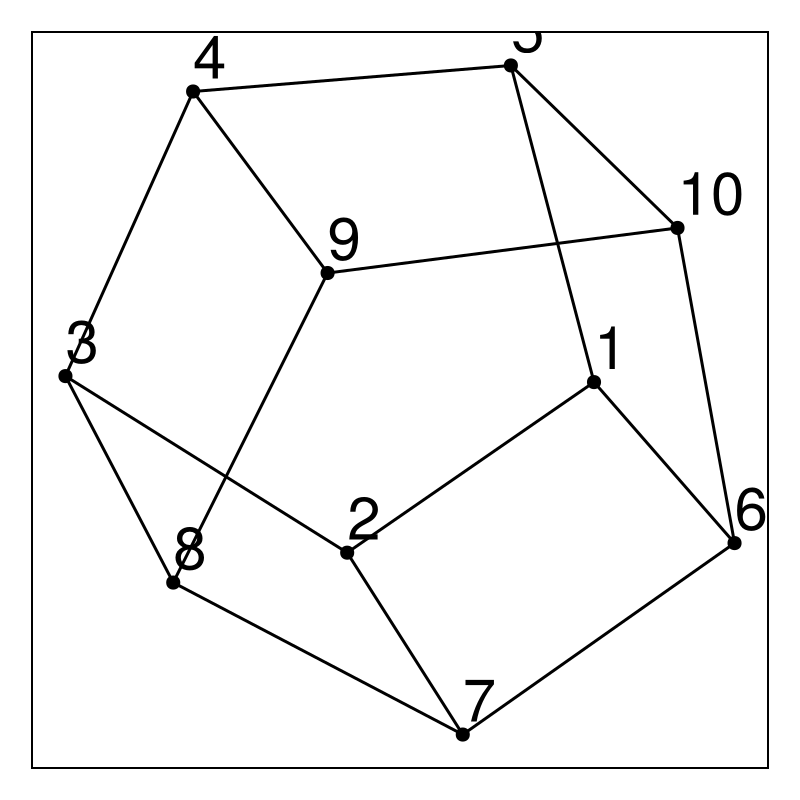
Change label font size
onf[] = 10; # check changes
fig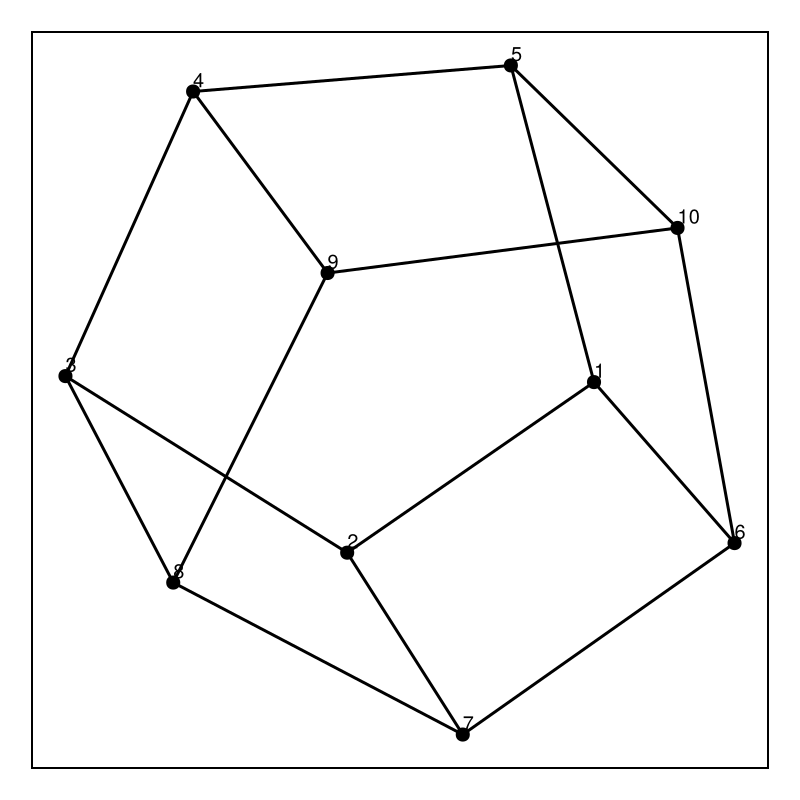
Do the same with a Dict
onf = Observable(Dict(1=>30, 10=>30));
ons = Observable(Dict(1=>30, 10=>30));
fig,ax,p = graphplot(gc; nlabels=repr.(vertices(gc)), node_size=ons, nlabels_fontsize=onf)
hidedecorations!(ax)
fig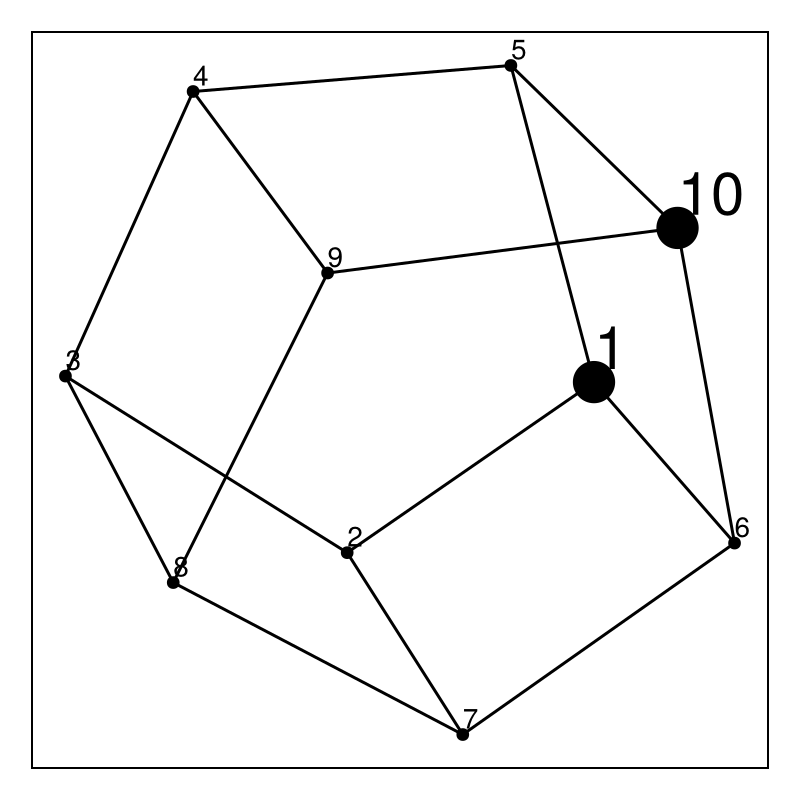
Change label font size
onf[] = Dict(7=>30); # check changes
fig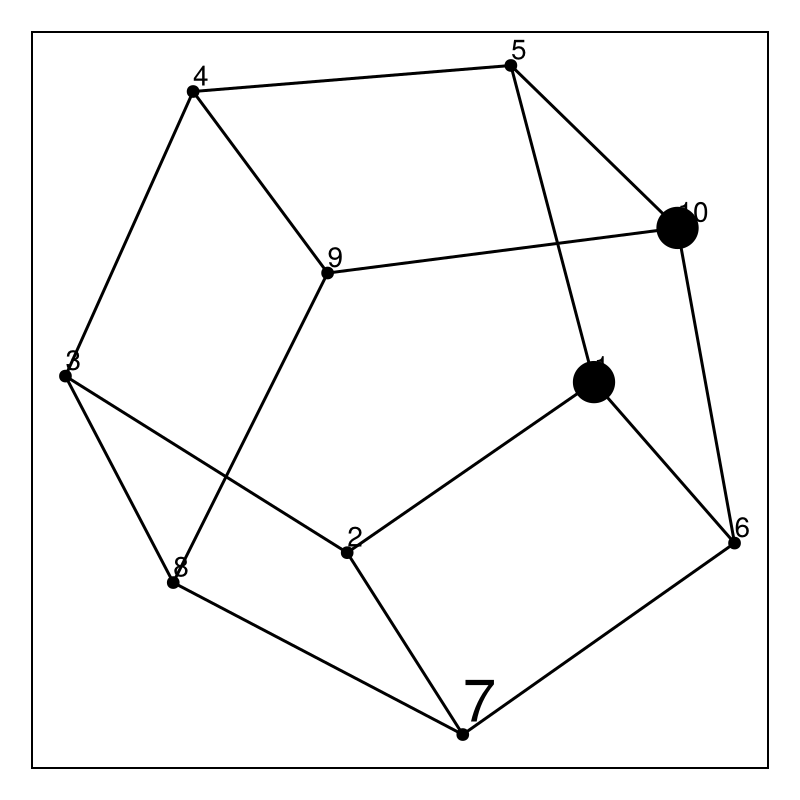
Change node size
 ons[] = Dict(7=>30); # check changes
fig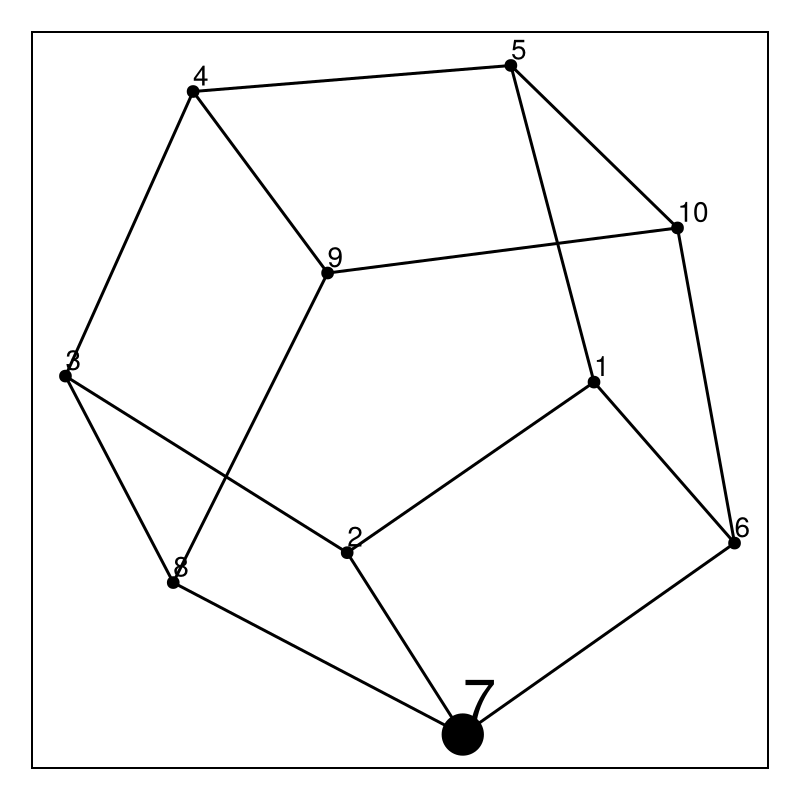
Do the same with a DefaultDict
ons = Observable(DefaultDict(70, 1=>30, 10=>30));
onf = Observable(DefaultDict(70, 1=>30, 10=>30));
fig,ax,p = graphplot(gc; nlabels=repr.(vertices(gc)), node_size=ons, nlabels_fontsize=onf)
hidedecorations!(ax)
fig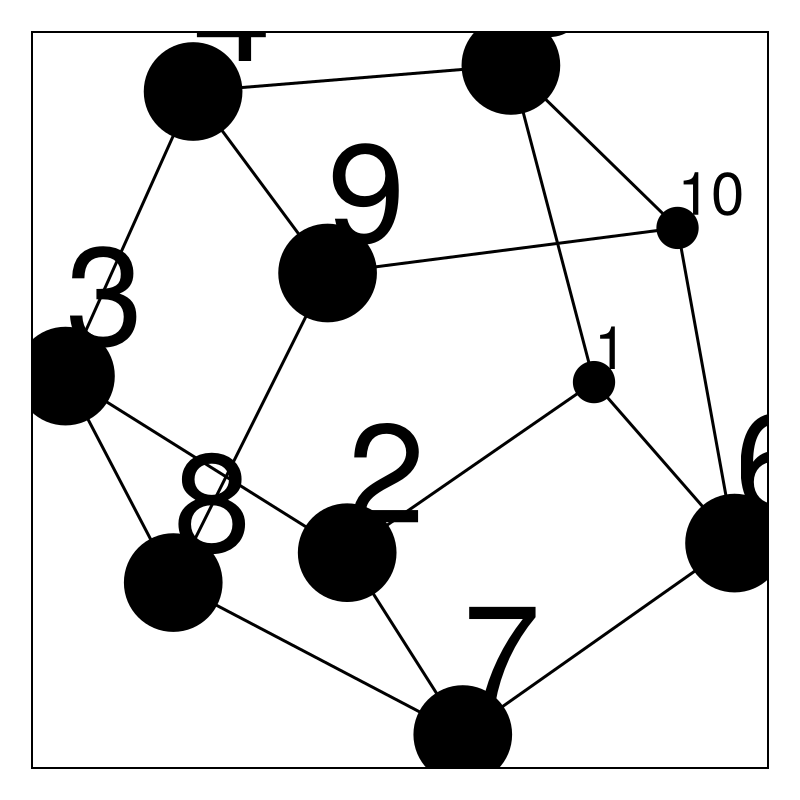
Change node size
ons[] = DefaultDict(20, 10=>70); # check changes
fig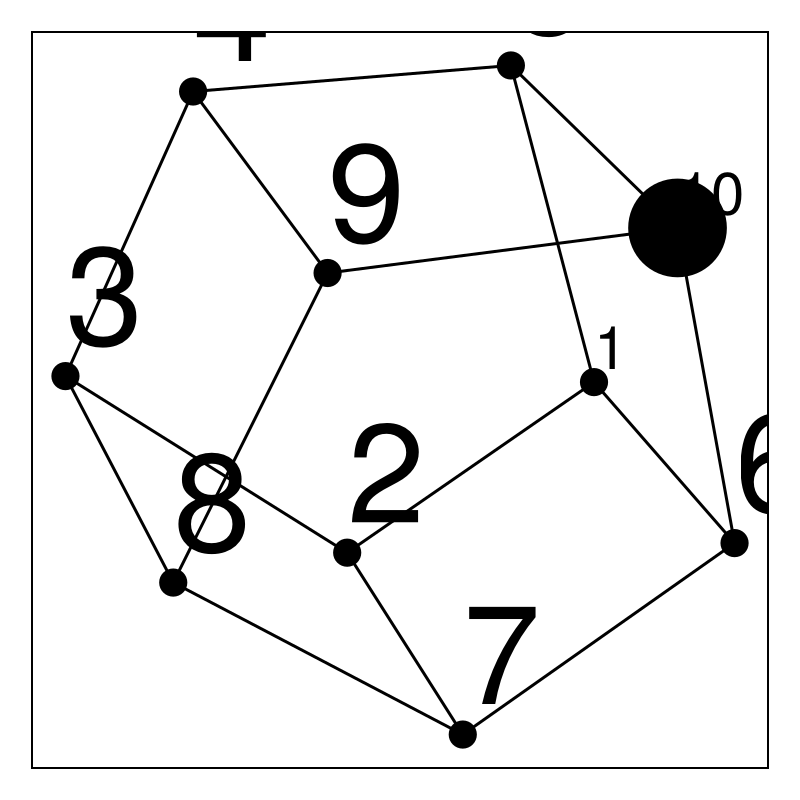
Change label font size
onf[] = DefaultDict(20, 10=>70); # check changes
fig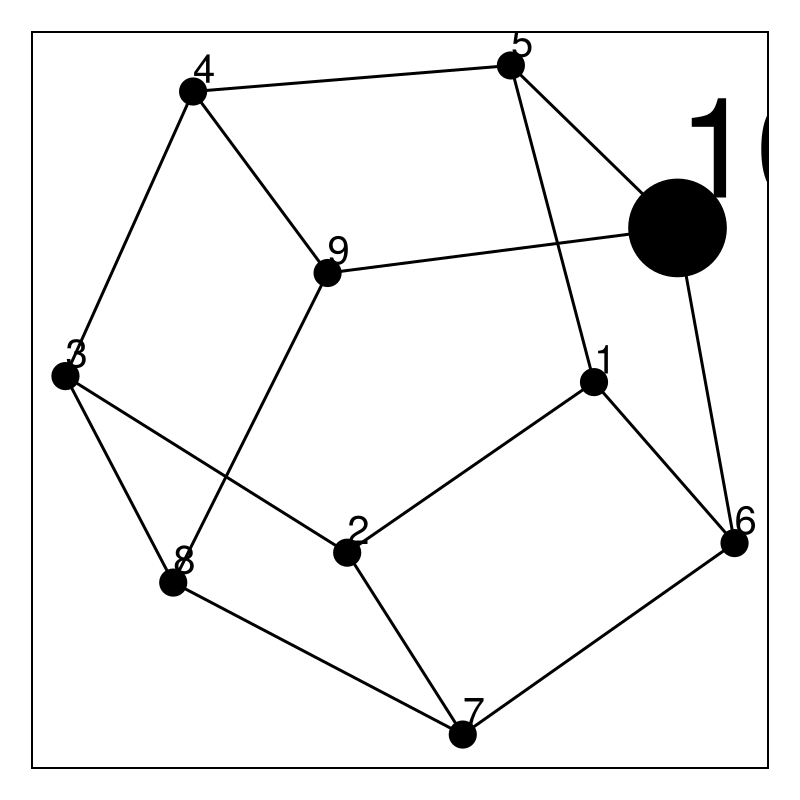
Dict and DefaultDict
Test out argument functionality with Dict and DefaultDict First with a normal Dict
gc = circular_ladder_graph(5);
fig,ax,p = graphplot(gc, nlabels=Dict(1=>"One", 2 => "Two"))
hidedecorations!(ax)
fig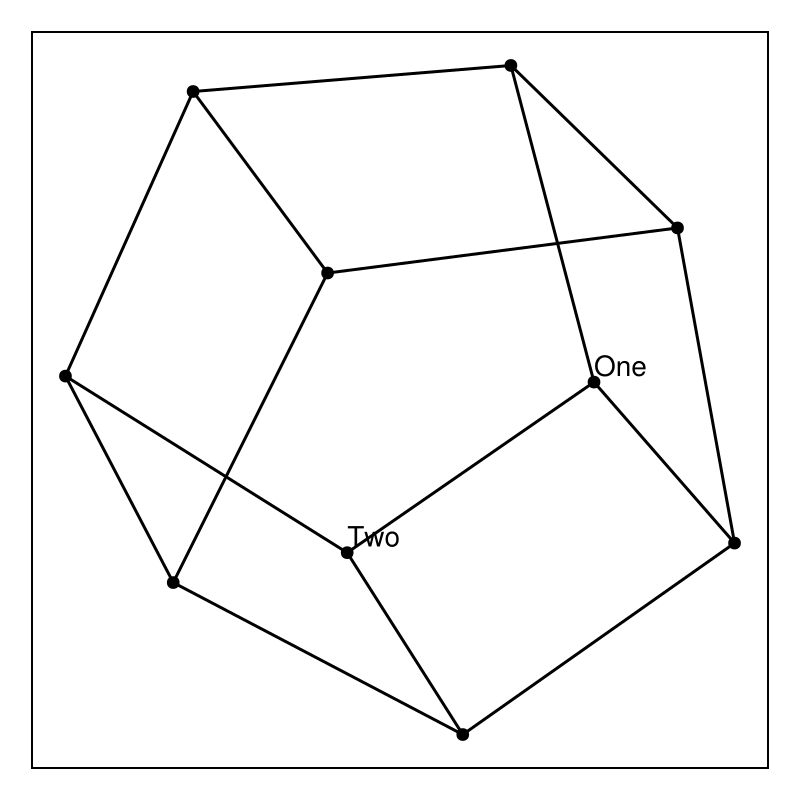
And also with a DefaultDict
fig,ax,p = graphplot(gc, nlabels=DefaultDict("Unknown", 1=>"One", 2 => "Two"))
hidedecorations!(ax)
fig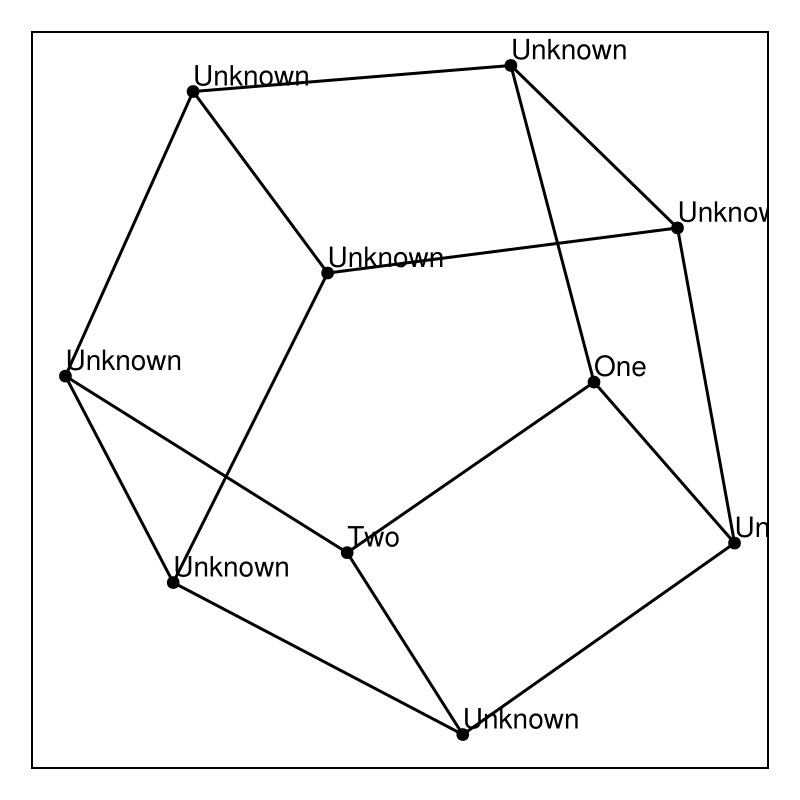
Use Dict{Edge} for edge arguments
fig,ax,p = graphplot(gc, edge_color=Dict(Edge(7,8)=>:blue))
hidedecorations!(ax)
fig
try out also the DefaultDict
fig,ax,p = graphplot(gc, edge_color=DefaultDict(:green, Edge(7,8)=>:blue))
hidedecorations!(ax)
fig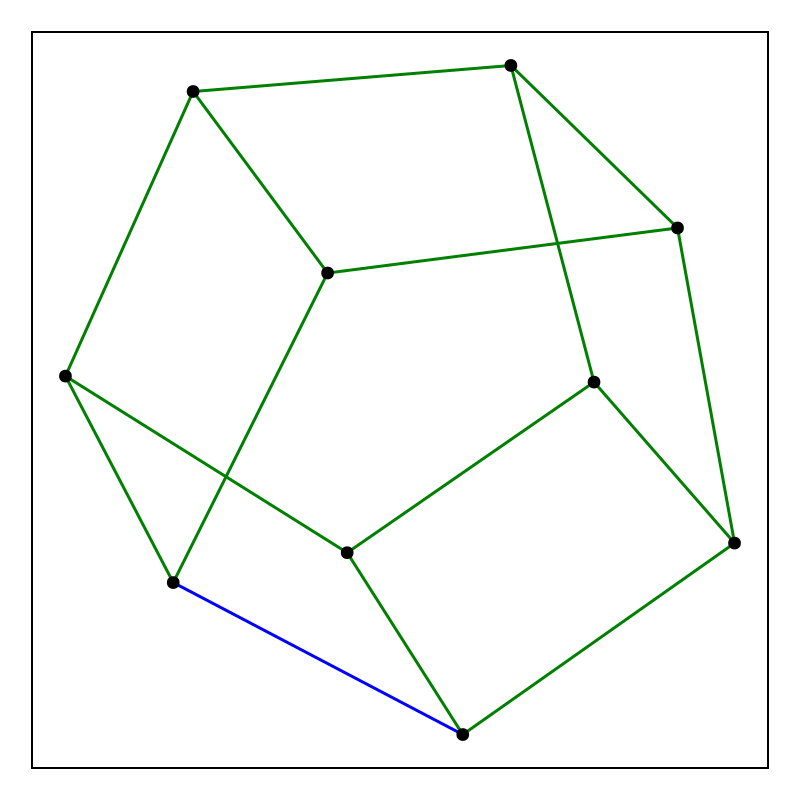
Of course you can still use integers labeling
ind = findfirst(==(Edge(7,8)) , collect(edges(gc)))
fig,ax,p = graphplot(gc, edge_color=DefaultDict(:green, ind=>:blue))
hidedecorations!(ax)
fig
The same can be done with all enumerations of edge arguments
fig,ax,p = graphplot(gc, elabels=DefaultDict("Unknown", Edge(1,2)=>"1-2", Edge(7,8) => "7-8"))
hidedecorations!(ax)
fig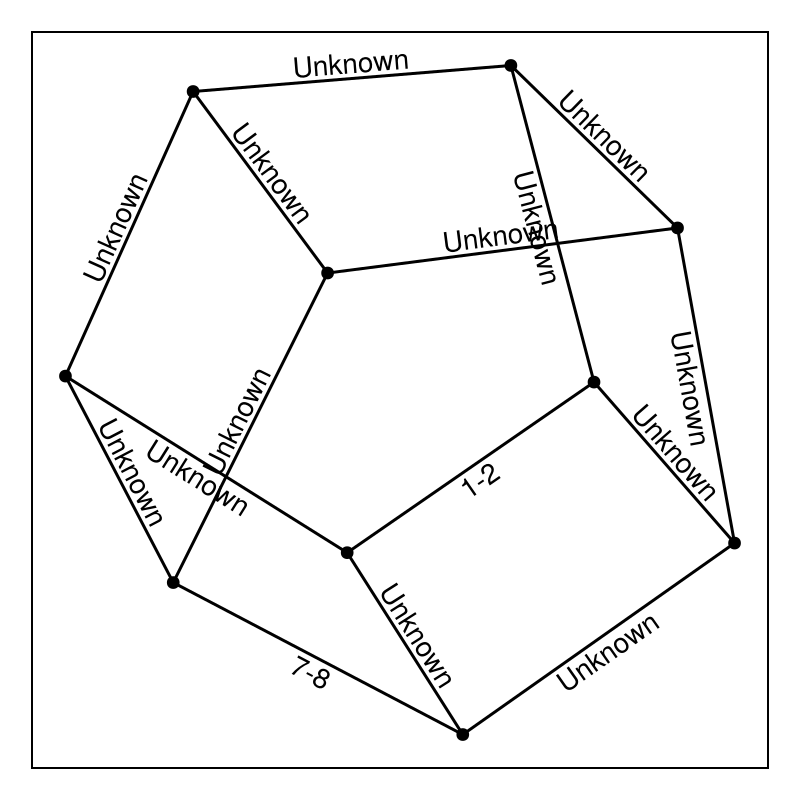
directed and undirected graphs are handled appropriately. For example for directed graphs
gcd = SimpleDiGraph(gc)
fig,ax,p = graphplot(gcd, elabels=DefaultDict("Unknown", Edge(8,7)=>"8-7", Edge(2,7) => "2-7"), nlabels=repr.(vertices(gcd)))
hidedecorations!(ax)
fig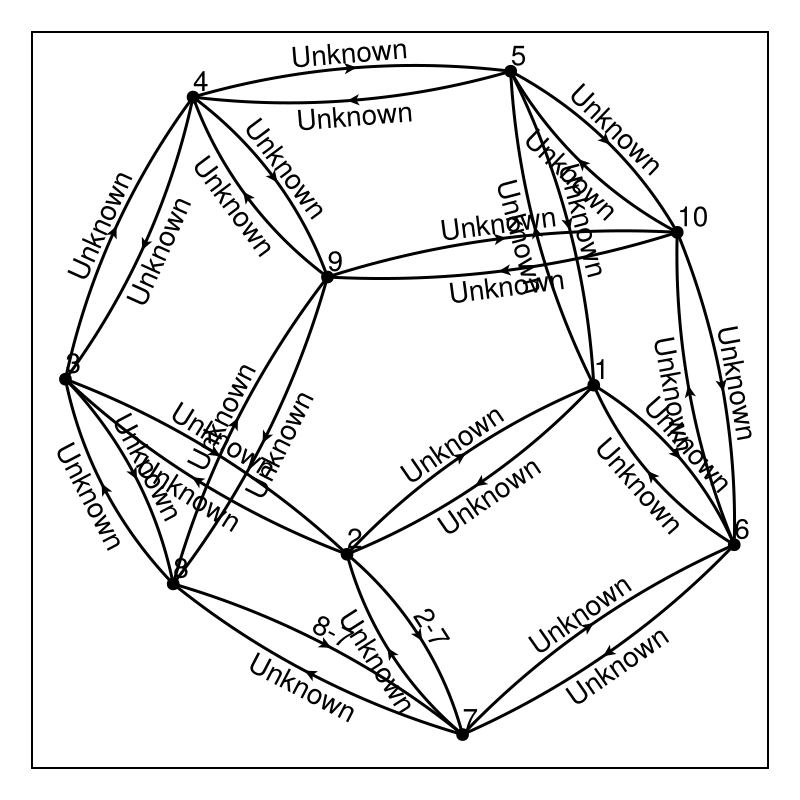
and non-directed graphs
fig,ax,p = graphplot(gc, elabels=DefaultDict("Unknown", Edge(8,7)=>"8-7", Edge(2,7) => "2-7"), nlabels=repr.(vertices(gc)))
hidedecorations!(ax)
fig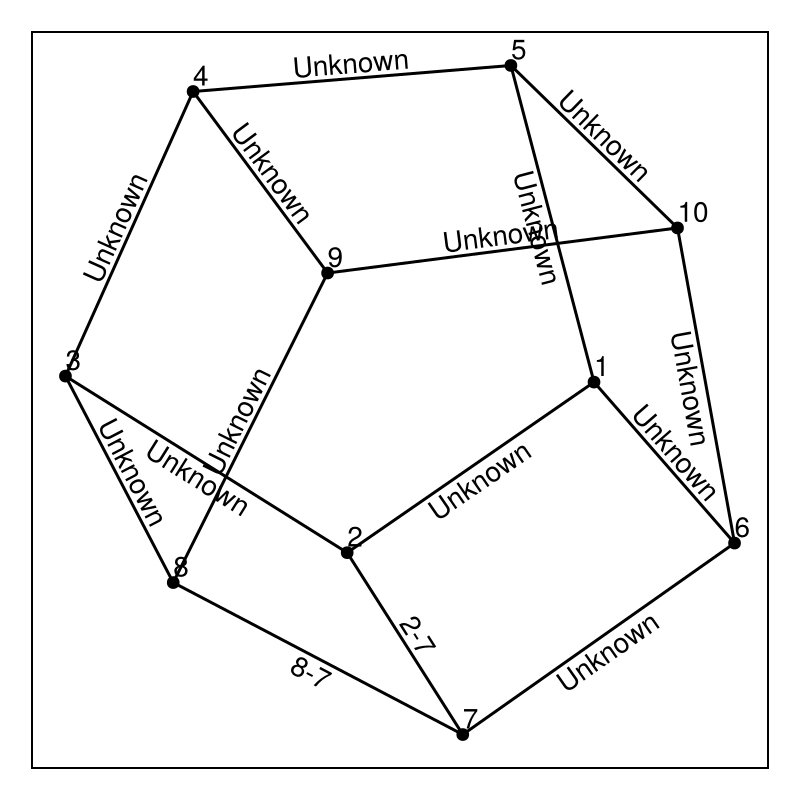
Test edge-specific updates
ec = Observable(Dict(Edge(8,7)=>:blue))
fig,ax,p = graphplot(gc, edge_color=ec, nlabels=repr.(vertices(gc)))
hidedecorations!(ax)
fig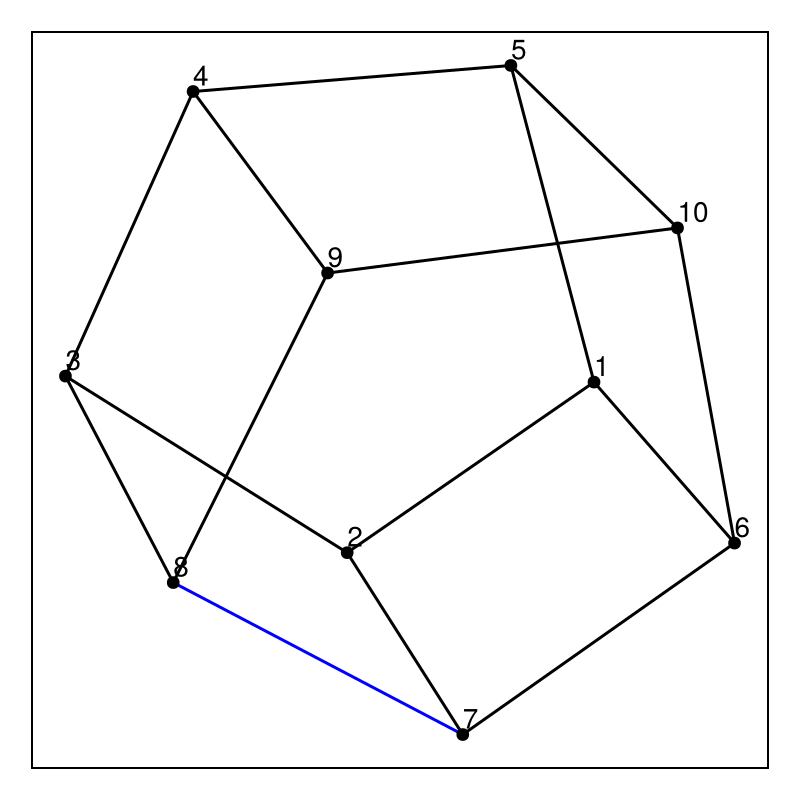
update Observable
ec[] = Dict(Edge(7,2)=> :green)
fig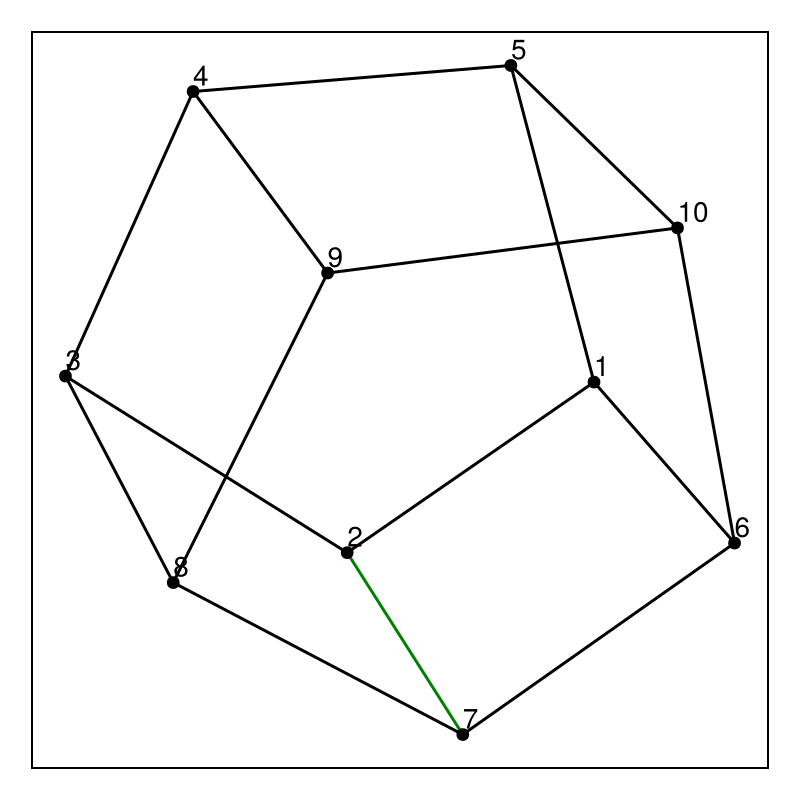
test 3d plots with i-labels
g = complete_graph(4)
fig,ax,p = graphplot(g; ilabels=["a", "b", "c", "d"], layout=NetworkLayout.Stress(dim=3))
fig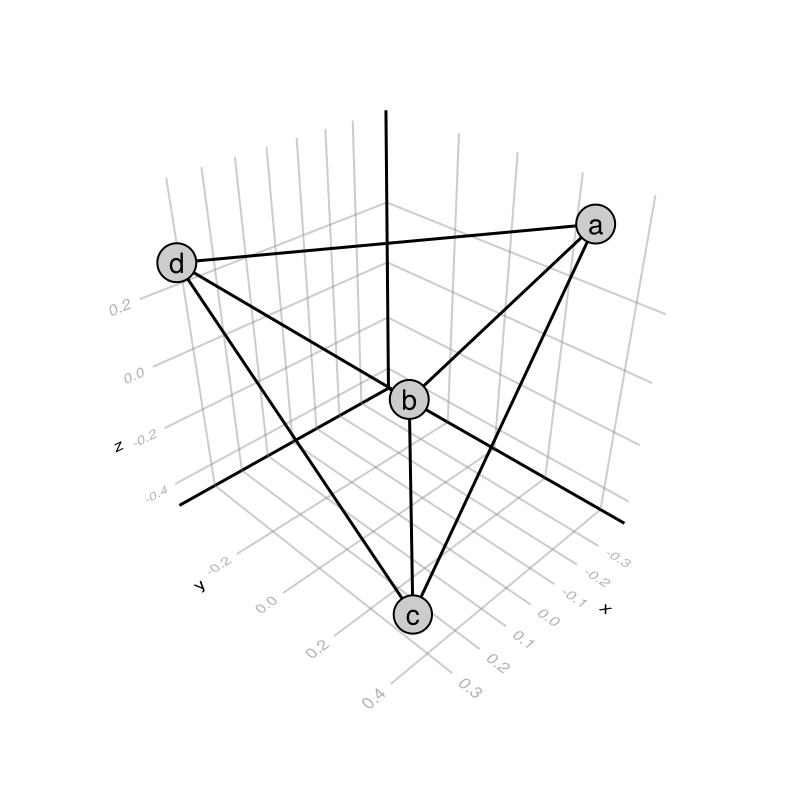
This page was generated using Literate.jl.