Dependency Graph of a Package
In this example we'll plot a dependency graph of a package using RegistryInstances.jl and and a DAG layout from LayeredLayouts.jl
using CairoMakie
using GraphMakie
using Graphs
using LayeredLayouts
using RegistryInstances
using Makie.GeometryBasics
using Makie.Colors
First we need a small function which goes through the dependencies of a package and builds a SimpleDiGraph object.
function depgraph(root)
    registries=RegistryInstances.reachable_registries()
    general = registries[findfirst(x->x.name=="General", registries)]

    packages = [root]
    connections = Vector{Pair{Int,Int}}()

    for pkg in packages
        pkgidx = findfirst(isequal(pkg), packages)
        uuids = uuids_from_name(general, pkg)
        isempty(uuids) && continue

        deps = String[]
        pkginfo = registry_info(general[only(uuids)])
        version = maximum(keys(pkginfo.version_info))
        for (vrange, dep) ∈ pkginfo.deps
            if version ∈ vrange
                append!(deps, keys(pkginfo.deps[vrange]))
            end
        end
        filter!(!isequal("julia"), deps)

        for dep in deps
            idx = findfirst(isequal(dep), packages)
            if idx === nothing
                push!(packages, dep)
                idx = lastindex(packages)
            end
            push!(connections, idx => pkgidx)
        end
    end
    g = SimpleDiGraph(length(packages))
    for c in connections
        add_edge!(g, c)
    end
    return (packages, g)
end
As an example we'll plot the dependency Graph of Revise.jl because it is one of the most important packages in the Julia ecosystem but does not have a huge dependency tree.
(packages, g) = depgraph("Revise")
N = length(packages)
xs, ys, paths = solve_positions(Zarate(), g)

# we scale the y coordinates so the plot looks nice in `DataAspect()`
ys .= 0.3 .* ys
foreach(v -> v[2] .= 0.3 .* v[2], values(paths))
In GraphMakie the layout always needs to be function. So we're creating a dummy function... We will use the Edge waypoints attribute to get the graph with the least crossings.
lay = Point.(zip(xs,ys))
# create a vector of Point2f per edge
wp = [Point2f.(zip(paths[e]...)) for e in edges(g)]

# manually tweak some of the label aligns
align = [(:right, :center) for i in 1:N]
align[findfirst(isequal("Revise"), packages)]           = (:left, :center)
align[findfirst(isequal("LoweredCodeUtils"), packages)] = (:right, :top)
align[findfirst(isequal("CodeTracking"), packages)]     = (:left, :bottom)
align[findfirst(isequal("JuliaInterpreter"), packages)] = (:left, :bottom)
align[findfirst(isequal("Requires"), packages)]         = (:left, :bottom)

# shift "JuliaInterpreter" node in data space
offset = [Point2f(0,0) for i in 1:N]
offset[findfirst(isequal("JuliaInterpreter"), packages)] = Point(-0.1, 0.1)

f, ax, p = graphplot(g; layout=lay,
                     arrow_size=15,
                     edge_color=:gray,
                     nlabels=packages,
                     nlabels_align=align,
                     nlabels_distance=10,
                     nlabels_fontsize=15,
                     nlabels_offset=offset,
                     node_size=[9.0 for i in 1:N],
                     edge_width=[3 for i in 1:ne(g)],
                     waypoints=wp,
                     waypoint_radius=0.5)
ax.title = "Dependency Graph of Revise.jl"
xlims!(ax, -0.6, 5.6)
hidedecorations!(ax); hidespines!(ax); ax.aspect = DataAspect()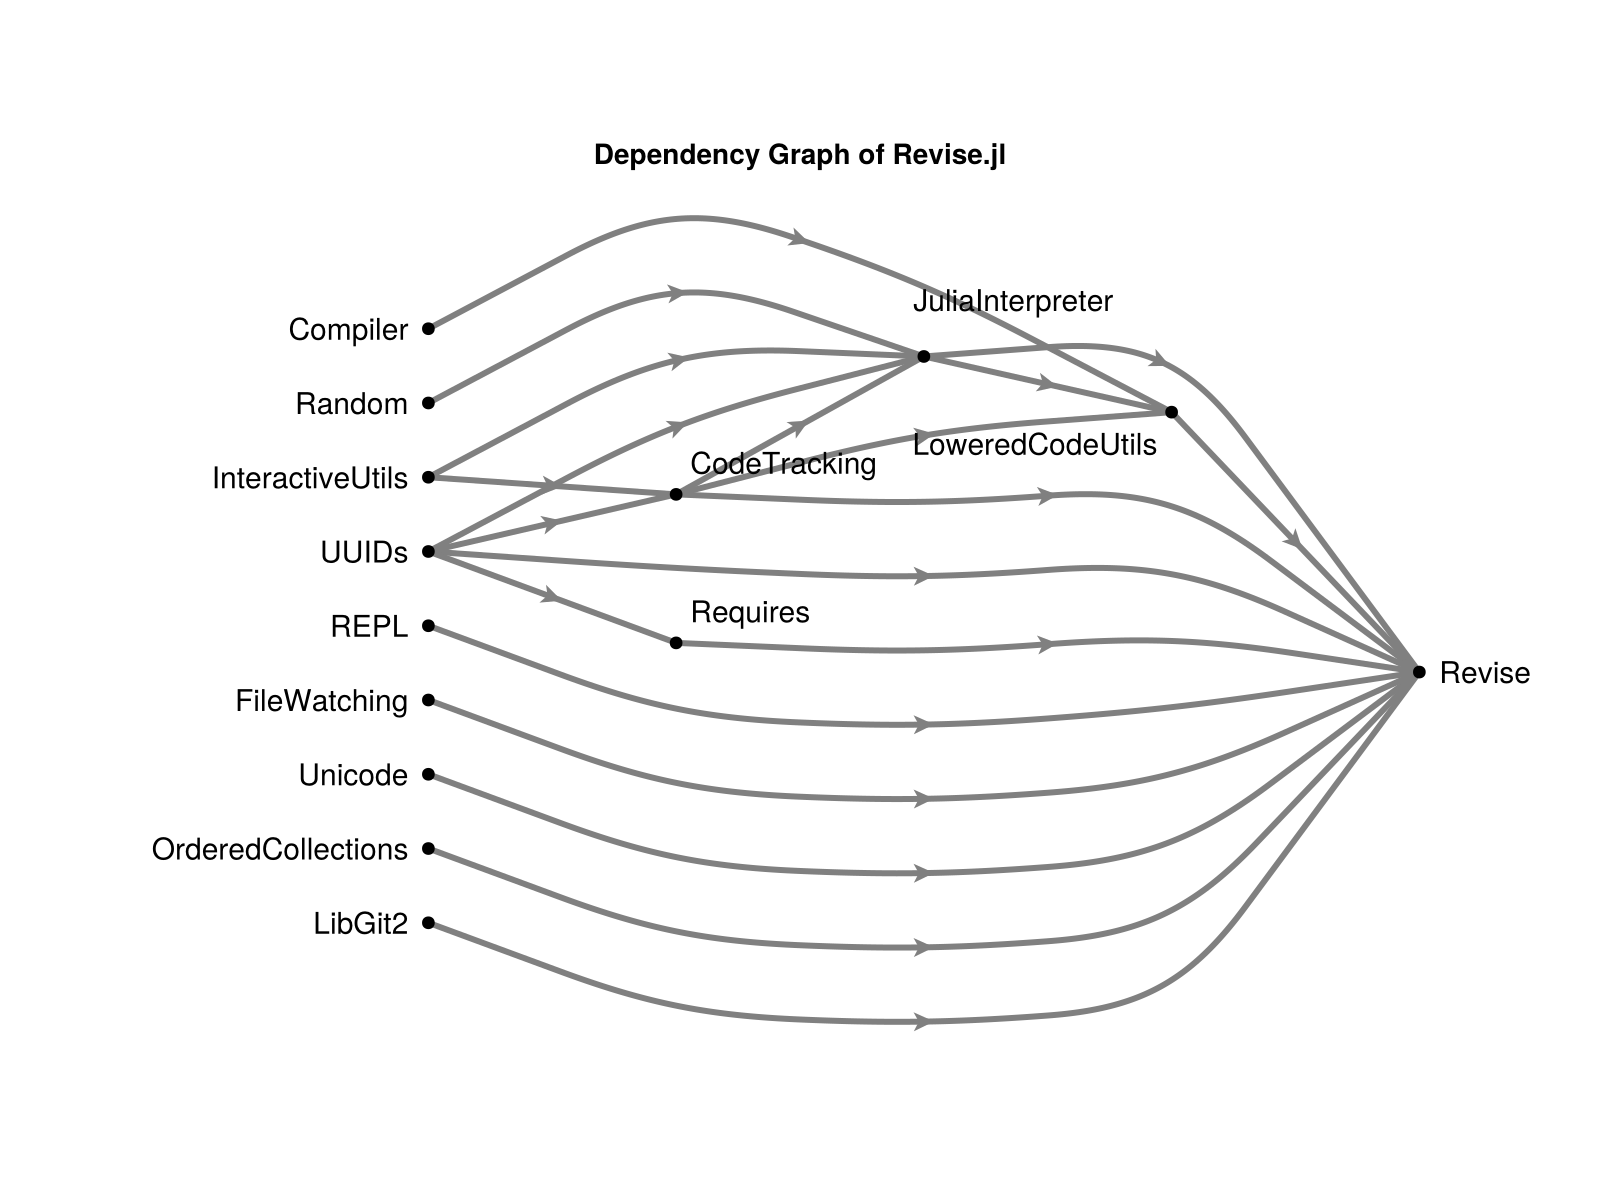
If you run this example using GLMakie you can add this code to play around with the interactive features.
deregister_interaction!(ax, :rectanglezoom)
register_interaction!(ax, :nodehover, NodeHoverHighlight(p))
register_interaction!(ax, :edgehover, EdgeHoverHighlight(p))
register_interaction!(ax, :edrag, EdgeDrag(p))
register_interaction!(ax, :ndrag, NodeDrag(p))
This page was generated using Literate.jl.