Visual representation of a decision tree
In this example we are going to plot a decision tree of type DecisionTree.jl using the Bucheim Layout from NetworkLayout.jl.
using CairoMakie
using Graphs
using GraphMakie
import MLJ
using NetworkLayout
using DecisionTree
This following code, which walks the tree and creates a SimpleDiGraph was taken and slightly modified from syntaxtree.jl. Thanks!
The model is a DecisionTree object. maxdepth defines the max Depth of the final tree generated.
import Base.convert
function Base.convert(::Type{SimpleDiGraph},model::DecisionTree.DecisionTreeClassifier; maxdepth=depth(model))
    if maxdepth == -1
        maxdepth = depth(model)
    end
    g = SimpleDiGraph()
    properties = Any[]
    walk_tree!(model.root.node,g,maxdepth,properties)
    return g, properties
end

function walk_tree!(node::DecisionTree.Node, g, depthLeft, properties)
    add_vertex!(g)

    if depthLeft == 0
        push!(properties,(Nothing,"..."))
        return vertices(g)[end]
    else
        depthLeft -= 1
    end

    current_vertex = vertices(g)[end]
    val = node.featval

    featval = isa(val,AbstractString) ? val : round(val;sigdigits=2)
    push!(properties,(Node,"Feature $(node.featid) < $featval ?"))


    child = walk_tree!(node.left,g,depthLeft,properties)
    add_edge!(g,current_vertex,child)

    child = walk_tree!(node.right,g,depthLeft,properties)
    add_edge!(g,current_vertex,child)

    return current_vertex
end

function walk_tree!(leaf::DecisionTree.Leaf, g, depthLeft, properties)
    add_vertex!(g)
    n_matches = count(leaf.values .== leaf.majority)
    #ratio = string(n_matches, "/", length(leaf.values))

    push!(properties,(Leaf,"$(leaf.majority)"))# : $(ratio)"))
    return vertices(g)[end]
end
Ooof, quite a bit of code!
Makie @recipe
Now let's define a MakieRecipe for the plot, to make plotting easy
@recipe(PlotDecisionTree) do scene
    Attributes(
        nodecolormap = :darktest,
        textcolor = RGBf(0.5,0.5,0.5),
        leafcolor = :darkgreen,
        nodecolor = :white,
        maxdepth = -1,
    )
end

import GraphMakie.graphplot
import Makie.plot!
function GraphMakie.graphplot(model::DecisionTreeClassifier;kwargs...)
    f,ax,h = plotdecisiontree(model;kwargs...)
    hidedecorations!(ax); hidespines!(ax)
    return f
end

function plot!(plt::PlotDecisionTree{<:Tuple{DecisionTreeClassifier}})

    @extract plt leafcolor,textcolor,nodecolormap,nodecolor,maxdepth
    model = plt[1]

    # convert to graph
    tmpObs = @lift convert(SimpleDiGraph,$model;maxdepth=$maxdepth)
    graph = @lift $tmpObs[1]
    properties = @lift $tmpObs[2]

    # extract labels
    labels = @lift [string(p[2]) for p in $properties]

    # set the colors, first for nodes & cutoff-nodes, then for leaves
    nlabels_color = map(properties, labels, leafcolor,textcolor,nodecolormap) do properties,labels,leafcolor,textcolor,nodecolormap

        # set colors for the individual elements
        leaf_ix = findall([p[1] == Leaf for p in properties])
        leafValues = [p[1] for p in split.(labels[leaf_ix]," : ")]

        # one color per category
        uniqueLeafValues = unique(leafValues)
        individual_leaf_colors = resample_cmap(nodecolormap,length(uniqueLeafValues))
        nlabels_color = Any[p[1] == Node ? textcolor : leafcolor for p in properties]
        for (ix,uLV) = enumerate(uniqueLeafValues)
            ixV = leafValues .== uLV
            nlabels_color[leaf_ix[ixV]] .= individual_leaf_colors[ix]
        end
        return nlabels_color
    end

    # plot :)
    graphplot!(plt,graph;layout=Buchheim(),
               nlabels=labels,
               node_size = 100,
               node_color=nodecolor,
               nlabels_color=nlabels_color,
               nlabels_align=(:center,:center),
               ##tangents=((0,-1),(0,-1))
               )
    return plt
end
Visualizing a DecisionTree
Now finally we are ready to fit & visualize the tree
iris = MLJ.load_iris()
features = hcat(iris[1],iris[2],iris[3],iris[4])
labels = iris[5]
model = DecisionTreeClassifier(max_depth=4)
fit!(model, features, labels)
DecisionTreeClassifier
max_depth: 4
min_samples_leaf: 1
min_samples_split: 2
min_purity_increase: 0.0
pruning_purity_threshold: 1.0
n_subfeatures: 0
classes: ["setosa", "versicolor", "virginica"]
root: Decision Tree
Leaves: 8
Depth: 4now we are ready to plot
graphplot(model)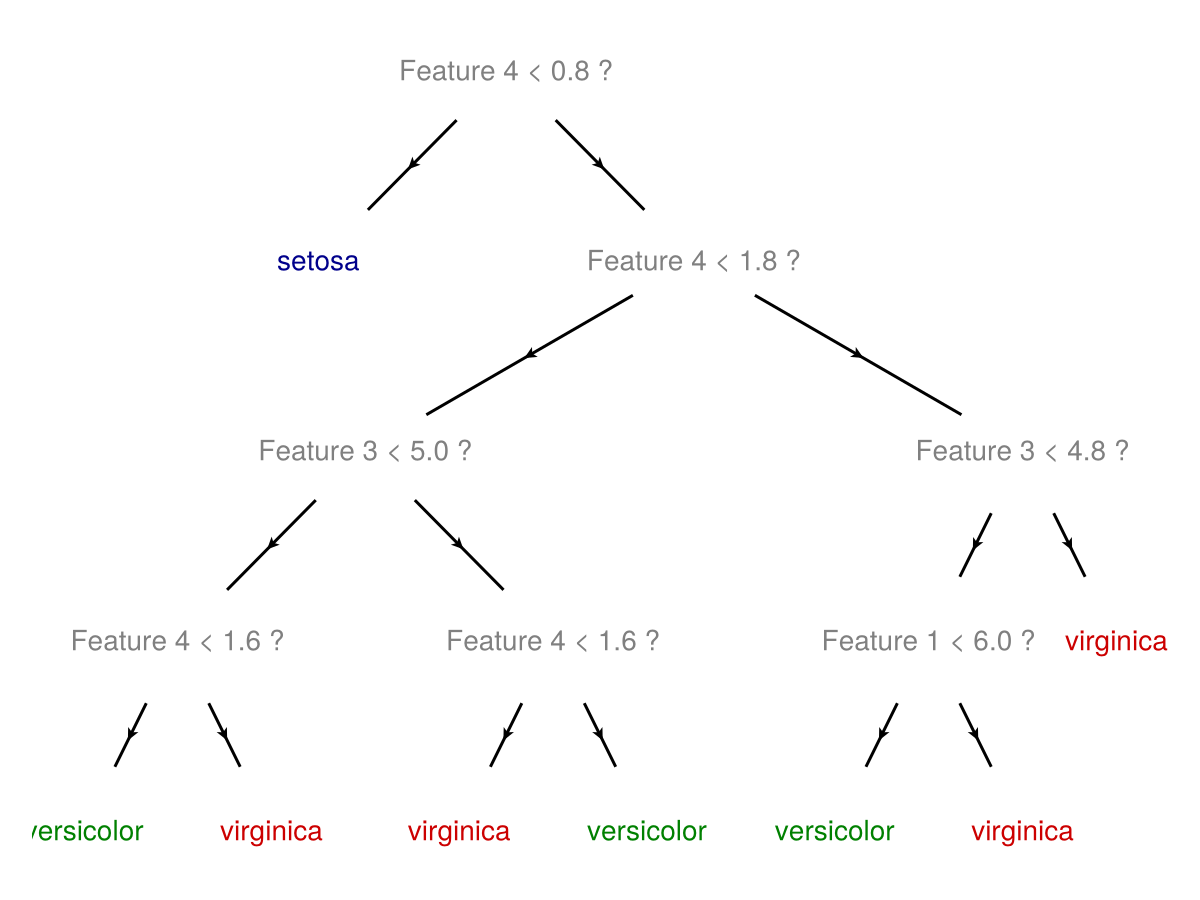
you can also specify depth, or modify colors
graphplot(model;maxdepth=3,textcolor=:darkgreen)
This page was generated using Literate.jl.